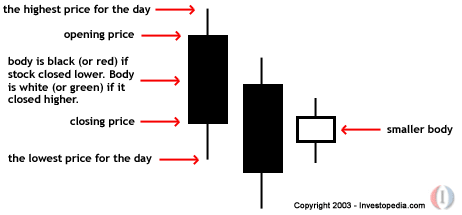
Nifty eod candles spinning bottom then hammer then doji and if we further analyse …it is looking like bullish harami at nifty chart all are indicating for a trend reversal …will we see an upblast /short covering / pullback rally today ?
If yes then we have to expect flat to positive opening today then a small move towards 5590 95 and will start moving towards 5650 5700…expecting extremely volatile session ahead..and closing above 5650 can not be ruled out …
bulls may celebrate today …
stock specific moves are expected ..
Trade in Nifty futures as per these levels
Buy at / above: 5603 Targets: 5622 – 5641 – 5659 – 5678-5702
Stoploss : 5583
Sell at / below: 5583 Targets: 5567 – 5551 – 5534 – 5515
Stoploss : 5603
Bullish harami ..is a trend reversal candle ..
A candlestick chart pattern in which a large candlestick is followed by a smaller candlestick whose body is located within the vertical range of the larger body. In terms of candlestick colors, the bullish harami is a downtrend of negative-colored (black) candlesticks engulfing a small positive (white) candlestick, giving a sign of a reversal of the downward trend.


it was shared yesterday ..
buy call at opening and sell after 1.20
again btst at 3.20
Never trade without stoploss order …buy
NIFTY OUTLOOK AND TRADING LEVELS FOR 26 June 2013.Harami


Thank you for sharing such nice information….. We also provides best stock tips, mcx ncdex tips, future market update, intraday trading calls, nifty sensex update and many more visit Nifty Future, Free trading tips and Intraday Future Tips
ReplyDeletePassTheWheel com offers drivers permit test help for the official learners license written knowledge test Practice sample test questions answers in Ontario, British Columbia ICBC , Alberta California DMV click here <a href="http://www.passthewheel.com/practiceTestQuestions/canada/ontario/g1/ontario-g1-practice-test.asp>British Columbia ICBC Class 5 Learner's Knowledge Test</a
ReplyDelete